Display Tools
This section describes the following display tools:
- Panels
- Navigation (Pan, Fly, Scroll View)
- Cursor Value
- Rotate (Rotate View, Up is Up, North Up, Shadows Down)
- Zoom
- Go To
- Mensuration
- Enhancement Tools
- Stretch
- Status Bar
- Band Animation
Panels
You can adjust the Layer Manager and Toolbox panels as follows:
- Click and drag on the inside border of the panel to make the panel larger or smaller. If you drag the border all the way to the outside edge of the ENVI window, the panel will be hidden.
-
Click the Show panel arrow on the outside edge of the ENVI window to show the hidden panel again.
- Click the Detach button
 in the upper-right corner of the Layer Manager or Toolbox to detach (or undock) them from the interface. They become floating dialogs that you can move to a different location or separate monitor if desired.
 - To re-attach (or dock) the Layer Manager or Toolbox to the main application window, choose one of the following options:
- Click the Attach button
 in the floating dialog.
 - Click the X button in the upper-right corner of the floating dialog.
- Click the Attach button
Navigation
Use the following methods to pan, fly, and scroll the view:
- Click the Pan button
 in the toolbar to pan around the displayed data.
 - Click the Fly button
 in the toolbar to continuously move in any direction.
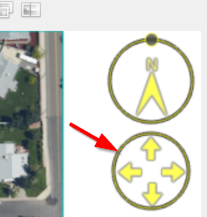
 -
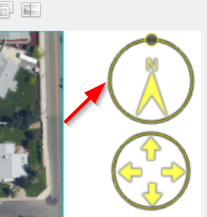
Fly controls also appear if you hover the cursor at the top right of the view. In the control circle, click on the arrows or on the lines adjacent to the arrows to fly through the view at 90 degree angles. Click on the circle's lines between the arrows to fly through the view at 45 degree angles.
-
Click the Scroll View button
 in the toolbar to display one section of a dataset at a time, in a vertical or horizontal direction. For example, suppose that the upper-left corner of an image is displayed in the view. The Overview shows the extent of the current view, in yellow:
Click the Scroll View button, followed by the right arrow icon in the Scroll window to display the next part of the image to the right. It displays only the part of the image defined by the view extent:
The Scroll View tool can be helpful for advancing through sections of a large image when you are counting features or otherwise exploring the image.
Cursor Value
The Cursor Value dialog contains information about the displayed data at the current cursor location and data from the Mensuration tool when applicable. Select Display > Cursor Value from the menu bar, or click the Cursor Value  button in the toolbar.
If multiple data layers are open, click the Show info for top layer only button to display cursor value information for the top layer only. Disable the button to show cursor value information for all available layers.
The Cursor Value dialog does not report any information during a View Portal (Blend, Flicker, or Swipe) process.
Images
For all images, the Cursor Value dialog reports the name of each layer.
For non-georeferenced images, it reports the following information for the current location:
- File x/y coordinates, in pixels.
- Data values for the bands displayed. You can change the precision of floating-point data values using the Data Precision in Cursor Value preference. You can change the reporting of data values from floating-point to scientific notation using the Data Notation in Cursor Value preference.
- Class names for classification images.
For georeferenced images, the Cursor Value dialog reports the following information for the current location:
- Latitude and longitude values.
- Map x (easting) and y (northing) coordinates.
- Military Grid Reference System (MGRS) coordinates.
- Map projection and datum, and whether the file contains rational polynomial coefficients (RPCs).
- File x/y coordinates, in pixels.
- Data values for the bands displayed.
Vectors
For all vector layers and Esri feature class layers, the Cursor Value dialog displays the following for the selected vector record:
- Vector layer name.
- The index of the current vector record (0-based) and the total number of records.
- For multi-part vector files, the index of the current vector part (0-based) and the total number of parts in the vector record.
- The index of the vertex (0-based) within the vector part and the total number of vertices in the part.
- The location of the native coordinates of the vector file.
- Attribute table data, if any.
On Demand Updates
The On demand updates button  is enabled by default. This means that the Cursor Value dialog only reports data for the pixel or vertex nearest the center of the red probe. It does not update until you perform one of the following actions:
Images
- Click anywhere in the view to move the probe over the clicked pixel. Or, click and drag the probe to a different location and release the mouse button.
- Double-click anywhere in the view to center the probe in the view over that location.
-
Enter pixel coordinates in the Go To window (in the toolbar) to move the probe to that location in the center of the view.
Vectors
- When a vector layer is displayed, click the Select button
 in the toolbar first. Clicking in the display will move the probe to that location and will select the nearest vector record. The Cursor Value dialog reports information about the selected vector record.
 - Pressing Shift-click in the display (with the Select button active in the toolbar) will snap the probe to the nearest vertex in the active layer and will select the nearest vector record.
While On demand updates are enabled, you can copy the data for the current pixel (or nearest vertex location) to the system clipboard, then paste it into an application of your choice. Click the Copy probe text drop-down button and select an option. The choices are:
- Copy All: All information listed in the Images and Vectors sections above.
- Copy Lat/Lon: Geographic latitude and longitude coordinates, for georeferenced files or those with RPC map information.
- Copy Map: Easting (x) and northing (y) coordinates, for georeferenced files or those with RPC map information.
- Copy MGRS: Military Grid Reference System (MGRS) coordinates, for georeferenced files or those with RPC map information.
When you disable the On demand updates button, the Cursor Value dialog reports real-time data as you move the cursor around the display.
Multiple Views
If multiple views of data are displayed, you can choose to report cursor value information for all views by clicking the Display information for all views button  . Click the button again to report cursor value information for the current view only.
With the On demand updates button enabled, click the Link views button  to link the location of the probe to all views. When you move the probe in one view, the probes in the other views move to the corresponding location.
Tip: This process may be easier if you first establish a Geo Link or Pixel Link among the views before invoking the Cursor Value dialog.
The Copy options described above will report cursor value information for all views.
Rotate
Use the following methods to rotate the display:
-
Click the Rotate View button
 to rotate the display in the current view. If the display includes annotation layers, most annotation items rotate with the associated image (you can change the default for an item in the Rotate with View property). By default, text, symbol, and picture annotations do not rotate; they retain their original orientation.
Place the cursor in the view and do one of the following:
- Click and drag the cursor to rotate clockwise or counter clockwise.
- Press an arrow key to rotate 5 degrees clockwise (down/right arrows) or counter clockwise (up/left arrows).
- Press and hold the Ctrl key, then press an arrow key to rotate 1 degree clockwise (down/right arrows) or counter clockwise (up/left arrows).
- Press and hold the Shift key, then press an arrow key to rotate 45 degrees clockwise (down/right arrows) or counter clockwise (up/left arrows).
-
A rotate control also appears if you hover the cursor at the top right of the view. Click on the small circle above the control and drag it to rotate the view in the desired direction. To rotate the view in 45 degree increments, press and hold the Shift key as you drag the control with the mouse. To return the view to North up double-click in the center of the control circle.
- Click the Up is Up button
 when North Up orientation is not helpful for interpreting features in the image. For example, an oblique image acquired from an unmanned aerial vehicle (UAV) may be rotated so that some features (such as tall buildings) are difficult to identify. For the Up is Up button to be enabled, the image must contain Rational Polynomial Coefficient (RPC) or Community Sensor Model (CSM) information. ENVI uses this information to compute the rotation angle.
 - Click the North Up button
 to orient the image with North up.
 - Click the Shadows Down button
 to rotate the display in the current view so that shadows are facing toward the bottom of the display. This option is only available for georeferenced SAR images in SICD format.
 - Use the drop-down list in the toolbar to select a fixed rotation angle for the display in the current view. The following options are available: 0, 90, 180, and -90.
-
Or, type your own degree of rotation and press Enter on your keyboard. This drop-down list interactively reports the current degree of rotation of the display when you use any rotation tool.
Zoom
Use the following methods to zoom in or out of the display:
- Click the Zoom button
 to zoom in on the display. Click and drag to draw a box over an area to zoom in to, or click once in the display to center the display on that location and zoom in by a fixed percentage.
 - Click the Fixed Zoom In button
 to zoom in to the center of the display by a fixed percentage. The default is 1.25x, which can be set using the Zoom Factor preference.
 - Click the Fixed Zoom Out button
 to zoom out from the center of the display by a fixed percentage. The default is 1.25x, which can be set using the Zoom Factor preference.
 - Click the Zoom to Full Extent button
 to zoom the full extent of the data layer.
You can also use the scroll wheel on your mouse to zoom in or out of the display. Press and hold the Shift key while scrolling for a faster zoom. Press and hold the Ctrl key while scrolling for a slower zoom.
See Working with Raster Layers for descriptions of other related zoom tools.
Go To
Use the Go To tool to jump to a specific location in an image and to center the current view over that location.

- Enter the coordinates in the Go To field, using one of the entry formats in the table below. You can also copy a location from the Cursor Value window and paste it in the Go To field.
- Press Enter.
ENVI stores the locations you enter during your session in the Go To drop-down list. To jump to a stored location, select the desired location from the drop-down list.
Note: If you use the Go To tool and the layer is not selected (that is, you clicked outside of any valid data region, but are still in the canvas), then ENVI uses the bottom layer for the geographic jump.
Separate coordinate values with a comma, a space, or a comma and a space:
Lat,Lon:
Enter the values in decimal degrees format or in degrees, minutes, seconds format. If the values fall within -180 to 180 for the x direction and -90 to 90 for the y direction, ENVI assumes the coordinates are lat/lon (for example, 179.9, 89.9). One exception to the range provided above is 1.0, 1.0, which assumes data coordinates.
Decimal degrees format examples:
40.004036,105.219047
40.004036N,105.219047W
40.0481N, 105.3420W
Degrees, minutes, seconds examples:
40 0 14.53,105 13 8.57
40 0 14.53N,105 13 8.57W
40 0'34.34"N, 105 13'46.20"W
DataX, DataY:
Enter the value as x,y points and append an asterisk (*) to one of the values to indicate it is a data coordinate.
Data x,y format examples:
181.1*, 91.1
169*, 79
29*, 45
MapX,MapY:
Enter the value as x,y points. If the x and y values are greater than 30,000, ENVI assumes it is a map coordinate.
Map x,y format examples:
481168,4426792
481872.8250, 4427702.4750
482970.42, 4427702.47
PixelX,PixelY:
Enter the value as x,y points. If both values are integers, or are outside the range used for Lat/Lon, ENVI assumes they are pixel coordinates. If x and y values are greater than 30,000, append a "p" to one of the values to indicate it is a pixel coordinate, not a map coordinate.
If the currently selected raster layer has xstart or ystart values defined in the associated header file, these offsets are taken into account when you enter pixel coordinates.
Pixel x,y format examples:
38p,45
433.5, 469.5
-0.1039p, 0.749
X/Y pixel coordinates in ENVI have values of one less than those in ENVI Classic. For example, a pixel location of [X:165, Y:73] in ENVI is the same as location [X:166, Y:74] in ENVI Classic.
MGRS: Enter MGRS coordinates as an alphanumeric string.
MGRS example:
13TDE8089728753.
Northing and Easting numerical values can have up to five digits of precision, which represents a 1 square meter grid.
Mensuration
Use the Mensuration tool  to measure distance and azimuth direction on an image. Use the Mensuration tool in combination with the Region of Interest Tool to measure distance for polyline, polygon, rectangle, and ellipse ROIs; and area for polygon, rectangle, and ellipse ROIs.
- Click the Mensuration button on the toolbar to toggle on the Mensuration and Polyline annotation tools, then draw a polyline on the image to calculate distance and direction (degrees relative to North). The distance and direction display in the Cursor Value window.
- The Polyline annotation tool is enabled by default when you select Mensuration. To use arrows instead of polylines for mensuration, click the Arrow annotation tool on the toolbar.
- Multi-segment polylines calculate and display distance for each segment as well as the total distance of the entire polyline.
- For Geographic Lat/Lon images, distance is calculated using the average latitude between the two endpoints of the line being measured.
- To use mensuration with ROIs, click the Mensuration button on the toolbar, then create or edit an existing ROI record. The measurement displays in the Cursor Value window (distance for polyline, polygon, rectangle, and ellipse ROIs; and area for polygon, rectangle, and ellipse ROIs). The Mensuration tool does not work with point ROIs.
- By default, georeferenced images display distance in meters. Non-georeferenced images display distance in pixels. Set the default measurement units using the Mensuration Distance Units preference.
- By default, ROIs display area in Units2. Non-georeferenced images display distance in pixels. Set the default measurement units using the Mensuration Area Units preference.
- To toggle off mensuration, click the Mensuration button on the toolbar.
Enhancement Tools
Enhancement tools interactively control the amount of brightness, contrast, stretch, and transparency for the selected image layer. For each tool, click and drag the slider, or enter a value in the adjacent field. You can also use the following to change slider values:
- Click on the slider bar to the right or left of the indicator or click the slider then use the Page Up or Page Down keys to move the slider value up or down incrementally by 10.
- Click on the icons to the right or left of the slider bar or click the slider then use the arrow keys on the keyboard to move the slider value up or down incrementally by one. The up/right arrow keys increase the enhancement; the left/down arrow keys decrease it.
- Click the slider then use the Home key to move the slider to 100 and the End key to move the slider to 0.
- Click the Reset
 button for the tool to return to the default value.
 - Click the Undo or Redo buttons, or select Edit > Undo action or Edit > Redo action from the menu bar to undo and redo actions.
The value in the adjacent field interactively updates as you move the slider using any of the options listed, and the view immediately shows the results.
Tip: If the enhancement tools are not fully visible, increase the size of the ENVI window.
Brightness

Use the Brightness controls to darken or brighten the display of the selected image. The valid range is 0 (dark) to 100 (bright). To return to the default value of 50, click the Reset Brightness button. The Brightness slider is disabled when viewing paletted images (for example, classification images) and vector layers.
Contrast

Use the Contrast controls to adjust the contrast of the selected image. The valid range for this slider is 0 (low contrast) to 100 (high contrast).
The Contrast slider is disabled in the following cases:
- When the Stretch Type option is set to No Stretch, Optimized Linear, Bipolar, Linear 1%, Linear 2%, or Linear 5%.
- When a pyramid file does not exist and downsampling is not available for the image
- Paletted images (for example, classification images)
- Vector layers
To return to the default contrast value of 20, click the Reset Contrast button.
Sharpen

Use the Sharpen controls to blur or sharpen the display of the selected image. The valid range for this slider is 0 (blurry) to 100 (sharp). To return to the default value of 10, click the Reset Sharpen button. Sharpen is disabled when viewing paletted images (for example, classification images) and vector layers.
Transparency

Use the Transparency controls to make your image or vector layer more opaque or transparent. The valid range for this slider is 0 (opaque) to 100 (transparent). To return to the default value of 0, click the Reset Transparency button.
Stretch
You can apply different stretch types to enhance the appearance of an image.
Default Stretch Types
If the associated header file for an image specifies a default stretch, that stretch is applied when you open the image. If the header file does not specify a stretch, then a stretch type is applied as follows:
- No stretch is applied to 8-bit byte data.
- An optimized linear stretch is applied to 16-bit unsigned integer data.
- A linear 2% stretch is applied to all other data types.
You can set the default stretch for these data types using the Default Stretch preferences.
Apply Stretches
See the Stretch Type Background topic for more details on each of the stretch options.
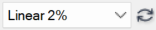
To apply a different stretch, select an option from the Stretch Types drop-down list.
- No stretch: Does not apply a stretch, with the following exception: if the data is integer and the range is 0 to 1, the image is recognized as a mask image and will be stretched from 0 to 1 to 0 to 255 so that the image displays as black and white.
- Bipolar: computes the absolute value of the pixels corresponding to the 2% and 98% locations on the negative and positive sides of the histogram, then assigns the greater absolute value to both ends of the stretch. See Bipolar Stretch for details. If the data does not include both positive and negative values, this stretch will have no effect.
- Equalization applies a histogram equalization stretch.
- Gaussian applies a Gaussian stretch. The default standard deviation value is 0.3. To apply a different standard deviation, click the Histogram Stretch
 button.
 - Linear, Linear 1%, Linear 2%, and Linear 5% apply a preset percent linear stretch. To apply a different percent linear stretch, click the Histogram Stretch button.
- Logarithmic logarithmically stretches the gray scale of the input image. It is a non-linear technique where the low-range brightness is enhanced. The logarithmic stretch is useful for enhancing features lying in the darker parts of the original image.
- Optimized Linear applies an optimized linear stretch, also known as a dynamic range adjustment. By default, 16-bit, unsigned integer data use the optimized linear stretch for display as it has a dynamic range set that is optimal for integer data. This stretch provides the maximum amount of information from the midtones and from the shadow and highlight regions of this data type.
- Square Root performs a square root gray scale transformation, then applied a linear stretch.
Click the Reset Stretch Type button to return to the default stretch type for the image.
"Stretch On" Options
ENVI determines the statistics for the selected stretch type by using the full image extent, or only the extent that is visible in the view.
- The default option is Stretch on Full Extent, denoted by the
 button in the toolbar.
 - To automatically update the selected stretch type as you pan around the image, click the Stretch on View Extent with Auto Update button
 .
. - To apply the selected stretch type to only the view extent, click the Stretch on View Extent
 button. If a pyramid file does not exist for the displayed image, the Stretch on View Extent option will not be available for use.
Histogram Stretch
Use the Histogram Stretch controls to adjust minimum and maximum histogram values for red/green/blue (or a single band) in the current layer. As with Stretch Types, you can calculate statistics on the full extent of the image, or only the extent that is visible in the current view.
Tip: If a pyramid file does not exist and downsampling is not available for the input raster, the Histogram Stretch will not be available for use.
Click the Histogram Stretch button on the toolbar to open the Histogram Stretch dialog.
Here are some tips for working in the Histogram Stretch dialog:
- For color images, the dialog contains a histogram of all three bands and shows their minimum and maximum values.
- For single-band images, the dialog contains a histogram of the band and shows its minimum and maximum values.
- Drag the minimum and maximum vertical sliders as needed in the red, green, and blue histograms. Or, type minimum and maximum values in the fields provided and press the Enter key.
- You can enter a custom clip percentage in the field provided, for each histogram. Or enter a clip percentage to apply to all histograms, using the field at the bottom of the dialog.
- With some data types such as floating-point radar images, the wide range of data does not provide enough fidelity in the default histogram to help you make meaningful modifications to the stretch. In this case, you can define a new histogram that uses a more appropriate minimum and maximum value. To do this, click the Histogram Parameters button
 next to each histogram to display the Histogram Parameters dialog. Here you can enter the Histogram Min, Histogram Max, and Maximum Bins.
 - The Brightness and Contrast controls are enabled when the Histogram Stretch dialog is displayed. As you adjust the Contrast setting, both the minimum and maximum histogram points adjust accordingly in the Custom Histogram Stretch dialog (for red, green, and blue).
- When the Stretch Type is set to Gaussian, you can enter any positive value for Gaussian Stdv (standard deviation) in the Histogram Stretch dialog. Press the Enter key to submit the value.
- When the Stretch Type is set to Square Root, you can enter a Square Root Factor in the Histogram Stretch dialog. Press the Enter key to submit the value.
- To reset the stretch to what it was before opening the dialog, click the Reset Dialog button.
- When the Histogram Stretch dialog is open, you can still select a Stretch Type option or use the Contrast control in the Toolbar. This lets you modify the type of stretch as well as the minimum and maximum parameters of the applied stretch.
Here are some tips for using the plot controls:
- To zoom in and out of the plot, click in the plot and roll the mouse wheel back and forth, or click and drag the middle mouse button to draw a box around the area to zoom into.
- Click and hold on a curve in the plot to show the X-Y line crosshair. As you move the cursor over the curve, the crosshair snaps to the closest data point. The X and Y values of the point appear below the plot.
- To reset the plot range to the original view, click the Reset Plot Range button .
You can optionally copy each histogram from the dialog and paste it into other applications such as Microsoft Word or PowerPoint. To do this, click inside of each histogram, press Ctrl+C, then paste into another application by pressing Ctrl+V.
Status Bar
The Status bar is the horizontal bar at the bottom of the ENVI interface.
Non-Georeferenced Files
For non-georeferenced files, the Status bar is blank unless the files contain RPC or Pseudo-RPC information. For these files, the status bar displays latitude and longitude of the current location of cursor in Degrees/Minutes/Seconds.
Georeferenced Files
For georeferenced files, the Status bar displays the following information about the base layer in the Layer Manager:
- Latitude and longitude of the current location of the cursor in Degrees/Minutes/Seconds (dynamically updating as the cursor moves)
- Projection and datum
- Military Grid Reference System (MGRS) coordinates
The Status bar displays information as you hover the cursor over either the Overview or the current view.
Note: The Status bar always displays information about the base layer in the Layer Manager, not about all layers loaded into the Layer Manager. For information on all layers, see Cursor Value.
You can customize the information displayed in each segment of the Status bar. To change the type of information displayed in a segment, right-click in a segment and choose an option from the menu.
The options are:
- Lat/Lon Degrees Minutes Seconds
- Lat/Lon Decimal Degrees
- Current Projection
- Map Coordinates
- NITF Security Banner
- NITF Acquisition Time
- Military Grid Reference System (MGRS)
- Raster Data Values: The pixel values for the top-most raster layer in the Layer Manager.
- Pixel Coordinates

When you customize the Status bar contents using this method, the Status bar only retains the information for the current ENVI session. You can permanently set defaults for each segment by setting the Status Bar Segment 1, 2, 3 preference.
Process Manager
If you are running one or more processes (for example, File > Save As, building pyramids, or any of the Toolbox options, the right-most segment of the Status bar displays the process name and status for the oldest running process, along with an option to cancel the process (click the Cancel Process  button). When all processes finish, this segment becomes blank.
As one or more processes are running, click the Process Description  button to display a window that shows the name and status of each process, and the name of the input raster images. (See image above).
Band Animation
To animate through bands of a multispectral or hyperspectral image:
- Open and display the image.
- Select Display > Band Animation and choose either Using Xtreme Viewer or Using Raster Series. Or, right-click the image in the Layer Manager and select Band Animation and choose Using Xtreme Viewer or Using Raster Series.
- See Animate Using Xtreme Viewer or Animate Raster Series and NITF Image Segments for full instructions.
measure
measurement
distance