|
<< Click to Display Table of Contents >> Interferometric Stacking - Post Processing Tools - Time Series Classification - Classification |
  
|
Interferometric Stacking - Post Processing Tools - Time Series Classification - Classification
|
<< Click to Display Table of Contents >> Interferometric Stacking - Post Processing Tools - Time Series Classification - Classification |
|
Purpose
This tool is used to generate a displacement classification based on the goodness of fitting according to the Akaike criterion. Each class of the classification identifies the areas that better fit the model.
Technical Notes
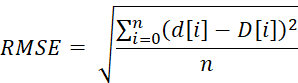
A classification map is created by selecting the best fitting model according to the Akaike Information Criterion which combines the fitting root mean square error (RMSE) with the number of free parameters in the model as following:
![]()
With:
![]() the number of parameters
the number of parameters
![]() the number of measurements
the number of measurements
![]() the displacement obtained by the fitting model
the displacement obtained by the fitting model
![]() the measured displacement
the measured displacement
Input Files
Input File
Modeling meta files (*_meta) created the Phenomenological Modeling and/or the Analytical Modeling panels.
Parameters - Principal Parameters
Generate Classified TS
By setting this flag a composed fitted time series will be generated with the fitted time series of the best fitting model.
Majority filter
By setting this flag a majority filter will be performed with a filter window defined by MF window size.
MF window size
Dimension of the sliding window used to perform the majority filter.
L1 threshold
The L1 norm (normalized by the number of dates in the time series) displacement threshold to consider a pixel as a stable one. Pixels under this threshold will be considered as no displacement points in the classification map.
RMSE threshold
The maximum root mean square of allowed for a model to be considered. If all models yield an RMSE over this threshold this pixel will be displayed as not classified on the classification map.
Output Files
A directory is created for each executed model combining the Output Root Name and the “_classification” string (I.e.: projectXXX_classification). Inside each of these directories you will find:
classification
A classification image showing the best fitting model for each pixel according to the lowest delta Akaike Information Criterion, non-classified areas, and stable areas.
classification_filtered
classification image filtered with a majority filter (if selected)
classification_daic
Delta Akaike Information Criterion value of the best fitting model for each pixel. *
classification_rms
RMS error of the best fitting model for each pixel. *
classification_input_TS
Best fitted time series images (if selected). This TS is a combination of the individual TS of each model using the TS of the best fitting model for each pixel. *
* if the classification majority filter is performed, these files correspond with this filtered classification
General Functions
Cancel
The window will be closed.
Help
Specific help document section.
Specific Function(s)
None.
Task, SARscapeBatch object, SARscapeBatch script example
References De Grandi, A. (2019). PASTA - Phenomena Aware Spatial-Temporal Analysis, Bsc Thesis, Università degli Studi dell’Insubria, Italy.