IDL Workbench Windows
This section provides brief descriptions of some of the Workbench windows you can open through the Window menu in the IDL Workbench main menu. For more details on these windows, see the Eclipse Workbench User Guide (https://help.eclipse.org/latest/index.jsp). Windows that are custom to IDL are described in more detail in this topic.
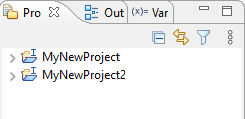
Project Explorer
Similar to a file browser, the Project Explorer view organizes your project files in a hierarchical tree-type view. If this window is not open, select Window > Project Explorer from the IDL Workbench main menu.
To use the Project Explorer:
- Right-click on a project or file to open a context menu. You will find descriptions of the menu options under main menu.
- Additional actions are available through the icons at the top right of the view. You can hover the icons to display short descriptions of them.
- For tips on how to set up and organize your IDL projects, see Best Practices in Organizing Your Code.
Editor
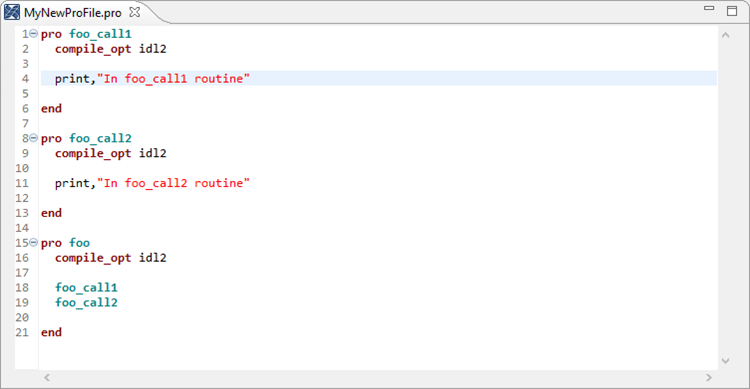
Use the Editor view to write, edit, and debug IDL programs. Following is an example of a file opened in the Editor.
Open files as follows; each file opened will open in its own tab.
- From the IDL Workbench main menu, select File > Open to browse for a file.
- From the Project Explorer (described previously), drag and drop one or more files onto the Editor view, or double-click on a filename.
- Drag and drop one or multiple files from your system's file browser (i.e., Windows File Explorer, or an equivalent file browser on Linux or Mac) to the Editor view .
- In the IDL Console, type
.edit <program name>or.compile <program name>at the IDL command line, which will open it in the Editor view. The file must be in your search path or in your IDL Console's current directory. (To add a directory to your path, select Window > Preferences > IDL > Paths, or change the current directory in the IDL Console view).
Tips and Tricks for the Editor
-
Line numbers are not enabled by default. To enable them, right-click in the column to the immediate left of the code and select Show Line Numbers.
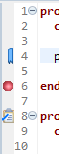
- To add a breakpoint where you want to halt running code, double-click in the column to the far left of the code line where you want the halt to occur, or right-click to the left of the code line and select Toggle Breakpoint. A breakpoint is marked with a red circle in the column (see the image above). To remove a breakpoint, double-click on it, or right-click on the breakpoint and select Toggle Breakpoint. The right-click context menu has additional breakpoint options.
- To set a bookmark in the code for a frequently-used resource that you can navigate to, right-click to the left of the code line and select Add Bookmark, then enter a name for the bookmark. A bookmark is marked with a blue icon in the column (see the image above). See Bookmarks for more information on using bookmarks. Bookmarks do not affect how the code runs, and they can be added only in files that are part of a project. To remove a bookmark, right-click on it and select Remove Bookmark.
- To add a reminder for something that needs to be done in the code, you can add a task marker. To set a task, right-click in the gray column to the left of the line numbers and select Add Task. Enter a task description and choose a priority. A task is marked with a clipboard icon in the column (see the image above). Tasks do not affect how the code runs, and they can be added only in files that are part of a project. To remove a task, right-click on it and select Remove Task.
Key Bindings
- To maximize/minimize the Editor view, press Ctrl+M.
- To display a pop-up tip for a routine, hover the mouse over a routine call.
- To open IDL Help, press F1.
- To open IDL Help to the Help topic for a routine, click the cursor on the routine name, then press F1 (Windows), Shift_+F1 (Linux), or Command+F1 (Mac).
Formatting
- Code templates help to stub out a procedure, function, or class. You can configure templates in Window > Preferences > IDL > Templates. To access code templates, start typing the name of a routine or function (i.e., CASE), then either:
- Right-click and select Code Templates, then select the template to insert.
- Press Ctrl+Space, then select the template to insert from the pop-up that appears.
- To insert an IDLDOC header pre-populated with tags based on a user-defined template, press Ctrl+Shift+I (definable in Preferences). Note that this is for routines only.
- The Workbench automatically closes all compound statement blocks; for example, the IF statement automatically gets an ENDIF.
- To toggle on or off comments for the current line, press Ctrl+;, or select Source > Toggle Comment from the IDL Workbench main menu.
- To auto indent after typing a line of code, press the Enter key. The line will indent by one tab. You can set this behavior in Preferences.
- If you paste a block of code into the Editor, Auto Formatting will indent it for you as you paste. You can set this behavior in Preferences.
- If you select a block of code in the Editor, you can auto format the code by pressing Ctrl+Shift+F to, or by selecting Source > Format from the IDL Workbench main menu.
Miscellaneous
- To open the source code to a call on a user-defined routine, press Ctrl+left-mouse. The source code will open in a new Editor view.
- To find files with the Open Resource dialog, press Ctrl+Shift+R. Start typing in the text box at the top (wildcards are OK), and the dialog will incrementally display and filter down a list of every file in your open projects that matches what you have typed. Press Enter to open the top item in the list. Open Resource also works well for opening multiple files with similar names. Open Resource only searches the files found in your IDL Workbench Project Explorer.
- To cycle through multiple open Editor views, press Ctrl+F6 or Ctrl+Page Up/PageDown.
- To highlight all occurrences of a word in the Editor, select a word to highlight it, then press F3 to cycle through and highlight all occurrences of it.
- To drag and drop lines of code from the Command History into the Editor , select a line of code in the Command History and drag it to the Editor. To select multiple lines in the Command History, press Ctrl or Shift to select the lines.
- To run a selected block of text in the Editor, press Shift+F8, or right-click and select Run Selected Text. This can be helpful while building or debugging code.
- The syntax of the code in the Editor view is colored according to the following defaults (configurable in Preferences under Window > Preferences > IDL > Syntax Coloring):
- Forest green: Comments
- Bright red: Strings
- Olive green: Numbers
- Black: Structure fields
- Brick red: Reserved words
- Dark blue: System procedures
- Bright blue: System functions
- Sea Green: User procedures
- Aqua: User functions
- Black: Plain text
Bookmarks
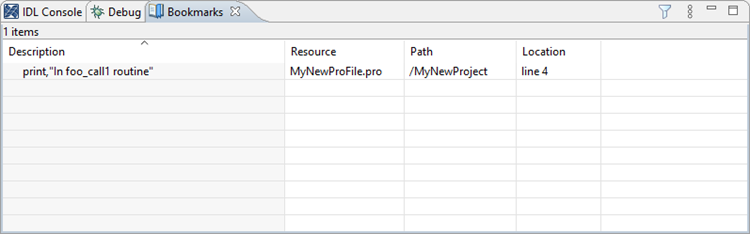
The Bookmarks view displays all bookmarks available in the IDL Workbench (the Editor section describes how to add them). You can navigate to a particular place in a file when it has been bookmarked. If this window is not open, select Window > Show View > Other >General > Bookmarks from the IDL Workbench main menu.
- To sort the bookmarks, click on the column heading that you want to sort the bookmarks by.
- To open the file that contains the bookmark, double-click on the bookmark. The file will open in the Editor view, with the bookmarked line highlighted.
- Change the description for a Bookmark by clicking in the Description field and typing a new description. The new description will populate back to the original file.
Problems
The Problems view shows collision detection - compilation errors and functions/routines with the same name that are located in your IDL path. Double-click a problem Description to highlight the associated block of code in your Editor view. If this window is not open, select Window > Show View > Other >General > Problems from the IDL Workbench main menu.
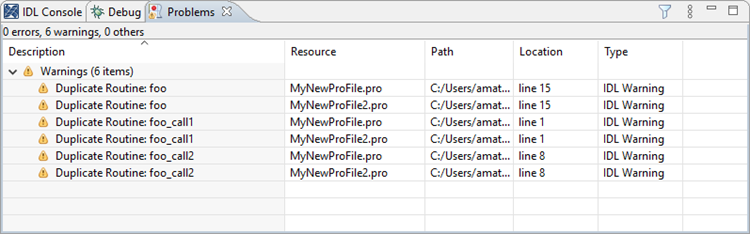
Note: IDL only has one namespace, so if there are multiple routines with the same name in the IDL path, the correct one might not be run.
Enable/disable collision detection in the IDL Workbench Preferences (Window > Preferences > IDL > Paths) by checking or clearing the box Warn when a routine is on IDL's path more than once.
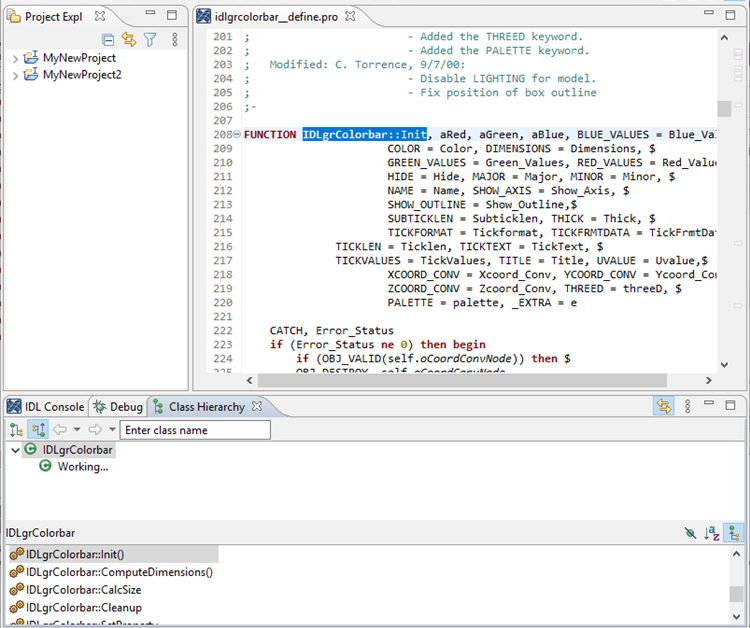
Class Hierarchy
The Class Hierarchy view displays the class members associated with your program file. If this window is not open, select Window > Class Hierarchy from the IDL Workbench main menu.
Clicking on a name in the Class Hierarchy view will highlight the selected class in the Editor view.
To link your files to the Editor view, toggle the yellow arrows button on the Class Hierarchy toolbar. When enabled, click the name of a routine/function call or property in the Class Hierarchy list to highlight the call in the Editor view.
Hover over the other toolbar buttons to learn what they will do.
Command History
The Command History view shows a list of recent statements you have typed into the IDL Console. If this window is not open, select Window > Command History from the IDL Workbench main menu.
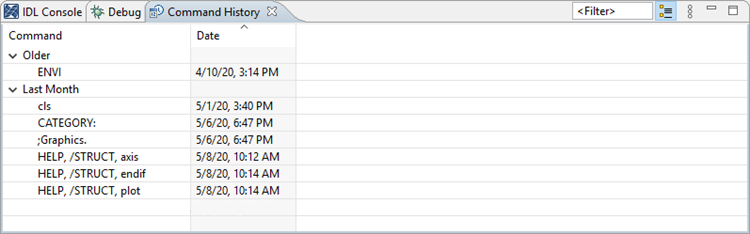
Clicking the "Date" column header allows you to sort commands by date from oldest or most recent.
To copy statements from Command History to the IDL Console or Editor:
- Copy/Paste to Console or Editor: Right-click on a command and select copy, then paste it in the Console or Editor view.
- Copy to Console: Double-click a command in Command History to copy the statement to the Console view.
- Drag and Drop lines of code: Drag and drop from Command History into the Editor to create programs from statements entered at the command line. Select multiple lines by holding down the Ctrl or Shift key while highlighting.
- Scroll Through History: In the IDL Console, use the Up or Down arrow keys to scroll through your Command History directly at the IDL prompt. Once you have retrieved a command, you can edit it before running. Press Enter to run the command.
The toolbar in the upper-right corner of the Command History view contains additional options:
- Enter a value in the Filter box to remove any commands from the history list that do not meet the filter criteria.
- Press the Tree View icon to toggle between organizing the commands in simple list or in a hierarchical tree based on date/time.
- Click the View Menu icon for options to display the Tree View, and to clear the command history.
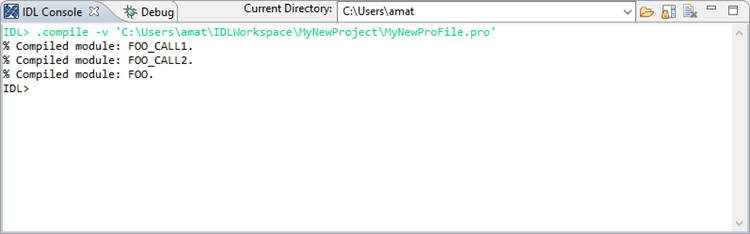
IDL Console
This view provides a console window where you can enter IDL statements at the IDL> prompt. Information such as output from programs, errors, warnings, and so forth is also displayed in this view. If this window is not open, select Window > IDL Console from the IDL Workbench main menu.
Other features that are included in IDL Console view include:
- Press the Ctrl+Space keyboard keys when you type a command to see options on how to complete it (Content Assist).
- The syntax you enter into the console will be highlighted using the same color scheme as the Editor view.
- To access your command history, use the Up and Down arrow keys.
- If you start typing a command you entered previously, press the Tab key to bring up previous commands that match the characters you type. Continue pressing Tab to step through the matches.
- Typical keybindings for moving your cursor within code also work in the Console view. For example, if your default keybinding scheme is set to Emacs, you can use Ctrl+A to move to the start of the line or Ctrl+E to move to the end of the line. To change keybindings in the IDL Workbench, select Window > Preferences > General > Keys from the main menu. You can choose a keybinding scheme or change individual keybindings.
Profiler
The Profiler view helps you analyze the performance of your applications. You can monitor the calling frequency and execution time for procedures and functions.
If Profiler view is not visible, select Window > Show View > Other > IDL > Profiler from the IDL Workbench main menu.
Run the Profiler from the Workbench
To use the Profiler from the Workbench, follow the steps below:
- Ensure that all of your code is compiled by running your application once, or by clicking the Compile button in the Workbench toolbar.
- Select the Profiler tab in the IDL Workbench.
- Click the Enable Profiling button in the toolbar of the Profiler tab.
- Once the Profiler is enabled, run your code. If your program is open in the Editor view, click the Run button in the Workbench toolbar, or type the commands to run it in the IDL Console view.
- When the program completes, return to the Profiler tab and click the Enable Profiling button again to stop the profiler.
After the profiler stops, you will see the results appear in the Profiler view (see the image below). The profiler displays the values for different times taken during each of the routines and statements used in the IDL code you are testing.
Run the Profiler from the IDL Console
You can also run the profiler using the TIC and TOC commands. The results will automatically appear in the Profiler view. Follow these steps:
- Ensure that all of your code is compiled by running your application once, or by clicking the Compile button in the Workbench toolbar.
- Enter the following code in the IDL Console:
IDL> TIC, /PROFILERIDL> MY_APPLICATIONIDL> TOC - The Profiler view will automatically be populated with the results. Select the Profiler tab to see the results.
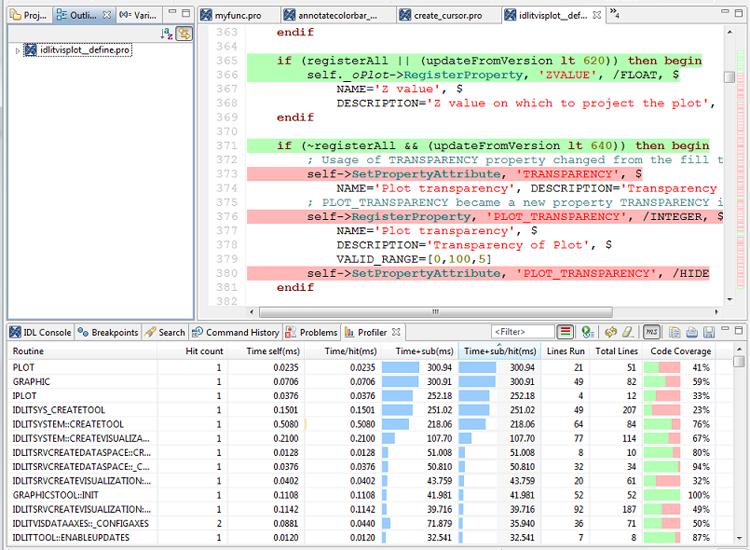
The Profiler view contains the following columns. Click on a column header to sort the data by a specific column.
- Routine: The name of the IDL routine. System routines (in C code) are shown in italics.
- Hit count: The number of times that the routine was called.
- Time self: The time spent only within the routine, not including any subroutines or other system routines.
- Time/hit: The time spent only within the routine, divided by the number of hits.
- Time+sub: The time spent within the routine plus all subroutines and system routines.
- Time+sub/hit: The time spent within the routine and subroutines, divided by the number of hits.
- Lines Run: The number of code lines that were executed within the routine. This is empty for system routines.
- Total Lines: The total number of code lines within the routine. This is empty for system routines.
- Code Coverage: The fraction of the total lines of code that were executed, which is just the ratio of Lines Run to Total Lines. A value of 0% indicates that none of the code was executed, while 100% indicates that all of the code was executed.
Code Coverage View
The Profiler view and integrated, which means the Editor view and show code coverage. If you double click on an IDL .pro routine, the Editor will be opened to that routine. If code coverage is not already displayed, you can show it by clicking the Show Code Coverage button on the Profiler view toolbar, or by selecting Run > Show Code Coverage from the IDL Workbench main menu. For more details, see Code Coverage.