Annotation Layers
Annotations are text, vectors, or graphics used to highlight features, details, or points of interest within an image. Use the Annotation toolbar tools to work with annotations. ENVI supports ENVI annotation files only (.anz, .ann). You can save annotations to new .anz files.
You can also write a script to create annotations using the ENVIAnnotationSet and ENVIAnnotationLayer routines.
See the following sections:
- Create and Save an Annotation Layer
- Add Annotations
- Delete Annotations
- Affix Annotations to the Display
- View Metadata
- Zoom Options
Create and Save an Annotation Layer
- Create a new layer by selecting File > New > Annotation Layer from the menu bar.
- Select a Source Data file when creating an new layer to define the new layer’s extents and map projection using an existing file.
- When the layer has been modified, the icon next to the layer name in the Layer Manager becomes shaded
 . The icon shading is removed once the layer is saved.
 - Save layer changes by right-clicking in the Image window view and selecting Save.
- Save layer changes to a new file by right-clicking in the Image window and selecting Save As. Also use Save As when saving a new layer for the first time, or if you are saving an ENVI
.anzfile to a new filename. - To hide an annotation layer in a view, disable the check box for that layer in the Layer Manager. To show the layer, enable the check box.
- To remove an annotation layer from the Layer Manager, right-click on the layer and select Remove. This removes the layer from the Layer Manager, but the file remains open and you can access it for redisplay from the Data Manager.
- To rename a layer, right-click its name and select Rename Item. Enter the new name in the Rename Item dialog and press the Enter key to accept it or press the Esc key to cancel. (Linux and Mac users should click the green check icon to accept the new name or click the red X icon to cancel.)
- If you have multiple views displayed, you can drag-and-drop annotation layers from the Layer Manager to any one of those views in the display or to the corresponding view icons in the Layer Manager. This creates a copy of the layer(s) to populate the views.
- If you open an OGC WMS raster layer that contains a legend, the legend displays in the Layer Manager. To create an annotation object from the legend that you can overlay on the image, right-click the layer name and select Load Layer as Annotation. This is useful, for example, in creating a Powerpoint presentation from the view.
Add Annotations
Annotation types include text, symbol, polygon, rectangle, ellipse, polyline, arrow, picture, legend, color bar, and scale bar. Here are some general tips for adding annotations:
- In the active layer, click the Annotations drop-down list in the toolbar and select the annotation tool type, then click where you want to add the annotation. Draw the annotations. See the Text, Polylines and Polygons, Arrows, Pictures, Legends, Color Bars, Scale Bars, and Image Magnifier sections below for specific instructions about these annotation types.
- Click and drag to move an annotation to a different location.
- Click and drag on a selection handle (indicated by a cyan-colored square) to resize an annotation. For picture annotations, the aspect ratio is always maintained.
- To unselect one or more annotations, right-click and choose Clear Selected. Or, press the Esc key.
- Symbol, ellipse, rectangle, and picture annotations are initially drawn orthogonally to the display axes, regardless of the orientation (rotation) of the underlying data layer.
- Once you create an annotation layer, its properties are displayed beneath the Toolbox in the lower-right corner of the ENVI application. Update the properties as needed.
- You can change the shared properties of multiple annotation items; for example, change the color of multiple text annotations. To do this, draw a box around the annotations in the current view, or use the Ctrl key to select multiple annotation items in the current view. Their shared properties are displayed beneath the Toolbox in the lower-right corner of the ENVI application. Update the properties as needed.
- You can also change the default properties of annotation items before you create them. Use the ENVI Preferences dialog for this. See Annotation Preferences for details.
To copy and paste annotation items after creating them, follow these steps:
- Use the Select button
 to select one or more annotation items. Use the Ctrl or Shift keys to select multiple items, or draw a box around multiple items to select them.
 - Right-click and select Duplicate Selected. The selected items are copied to the view.
- Click and drag to move the new items as needed.
The following sections provide details about specific annotation types.
Text
- Text annotations are initially drawn horizontally with respect to the display.
- To accept the text, click elsewhere in the current view. Or press the Esc key.
- To create superscript text, press the Ctrl+U keys and type the text.
- To create subscript text, press the Ctrl+D keys and type the text.
- To return to regular text from superscript or subscript, press the Ctrl+N keys.
- To insert a line break, press the Enter key.
- To add four spaces between letters, press the Tab key.
Symbol, Polygon, Polyline , Rectangle, or Ellipse
- Create a Symbol annotation by clicking where you want the symbol to appear on the view.
- Create a Polyline or Polygons by clicking and dragging to draw them, or click at intervals to add vertices one at a time.
- To draw a square or circle, with the Rectangle or Ellipse tools, press the Ctrl key as you click and drag.
- Use the right-click menu options to accept vectors when they are drawn.
Arrow
- Click and drag on a selection handle (indicated by a cyan-colored square) to resize or rotate an arrow. To rotate it in 45° increments, click the Shift key as you rotate it.
- Click and drag arrows to move them.
Image Magnifier
Image magnifier annotations are windows that display magnified views of selected areas in an image; for example:
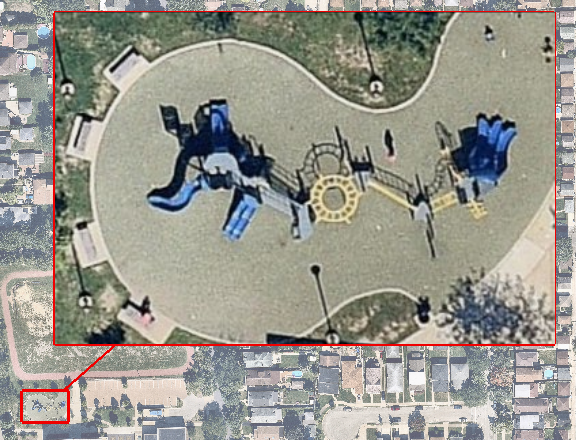
If multiple data layers are displayed, the image magnifier will only apply to the selected layer.
Follow these steps:
- Select Image Magnifier from the Annotations drop-down menu in the toolbar.
- Click and drag to draw a box around an area in the displayed image that you want to magnify. A window appears, showing a magnified view of the area you selected. A yellow line connects the magnifier window to the box that you drew.
- Click and drag to move the magnifier window to a different location, if desired.
- Click and drag the corner handles of the magnifier window to resize it.
Note: For best visual results, make sure your view is not rotated when creating image magnifier annotations.
The properties of the image magnifier are displayed in the Layer panel, beneath the Toolbox in the lower-right corner of ENVI. Update the properties as needed.
- The line properties affect the appearance of the connector and boxes that make up the image magnifier.
- The Zoom Factor property allows you to increase or reduce the size of the magnified area. A Zoom Factor value of 1 means the area displayed within the magnifier window is at full resolution.
Tip: If the magnifier window blends in too much with the surrounding base image, select the base image in the Layer Manager and use the Transparency slider in the ENVI menu bar to increase its transparency. In the image above, the transparency of the base image was increased to 40% to better visualize the magnifier window. Also in this example, the Line Color property was changed to red.
Legend
Follow these steps to add a user-defined legend:
- Select Legend from the Annotations drop-down menu in the toolbar.
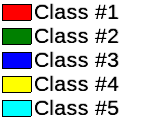
- Click on a location in the Image window where you want to display the legend. If an ENVI classification image is displayed, a default legend is created with the same properties (such as names and colors) as the classification image. Otherwise, a default legend is added with five classes:
- The properties of the legend annotation are displayed beneath the Toolbox in the lower-right corner of the ENVI application. Click inside of the Names and Colors field and click the arrow icon. The Edit Legend Names and Colors properties dialog appears.
- Edit the legend names and colors as needed and click OK.
- Edit other legend properties as needed.
Follow these steps to add a legend with the same class names and colors of a classification image that is not already open in ENVI:
- Select Legend from the Annotations drop-down menu in the toolbar.
- Click on a location in the Image window where you want to display the legend.
- Right-click on the Legend item in the Layer Manager (or right-click on the annotation item in the Image window), and select Import from Classification.
- In the Data Selection dialog, select a classification image from which to import class names and colors.
- Click OK.
Tip: You can also click the Import From Classification File button  in the Edit Legend Names and Colors dialog, described above. When the Data Selection dialog appears, select a classification file and click OK.
Picture
- You can create a picture annotation from any raster format that ENVI supports. Click the Annotations drop-down list in the toolbar and select Pictures > From File or Pictures > From ENVI to select a raster.
- The raster can have any number of bands. If the raster contains up to four bands, use the Annotations > Pictures > From File option to import it. If the raster contains more than four bands, you must open the raster in ENVI first and then select Annotations > Pictures > From ENVI to import it.
- You can define a spatial and spectral subset when selecting the raster.
- If the raster has a data type other than byte, a 2% linear stretch will be applied to all of the bands you select.
- If the raster has any transparent pixels, they will appear transparent in the annotation.
- If you select a PNG file with a full alpha channel, the alpha channel will be used in the annotation.
- When resizing picture annotations, the aspect ratio will always be maintained.
- You can create a picture annotation from any plot or scatterplot window that is displayed in ENVI. Click the Annotations drop-down list in the toolbar and select Pictures > From Plot.
Color Bar
Follow these steps:
- Display a single-band greyscale image.
- Right-click on the image layer in the Layer Manager, select Change Color Table, and select a predefined color table.
- Select Color Bar from the Annotations drop-down menu in the toolbar.
- Click on a location in the Image window where you want to display the color bar.
- The properties of the color bar are displayed beneath the Toolbox in the lower-right corner of the ENVI application. You can edit the labels that appear under the color bar. To do this, click inside of the Labels field and click the arrow icon. Edit the labels as needed.
- To retain the same scale for the color bar as you zoom in or out, set the On the Glass property to True.
Tip: The !M£!X string represents the ≤ character, and the !M3!X string represents the ≥ character. Different system fonts may render these characters differently.
If the view contains more than one single-band image layer, the color bar annotation will be associated with the top-most layer. If the color table or stretch type changes in the image layer, the color bar annotation will update accordingly. If you remove the image from the display, the color bar will still remain but will use the last known color table and stretch type.
Scale Bar
Scale bar annotations initially show distance in the units of the current base projection. For example, if the base projection is UTM Zone 13 (WGS-84), the scale bar distance is in meters. If the current base projection has angular units such as Geographic latitude/longitude, ENVI converts the units to meters for the scale bar.
- Scale bar properties are displayed beneath the Toolbox in the lower-right corner of the ENVI application. Update the properties as needed.
- The Scale on Zoom property is not available for scale bar annotations.
- To adjust the length of the scale bar, choose one of the following options:
- Modify the Increment property value.
- Modify the Length property value, in pixels. Modifying the Length will update the Increment so that the scale bar fits within the designated length.
- The scale bar distance is approximate when used with datasets that are in an RPC or pseudo spatial reference. The default units are meters.
When a scale bar annotation is used on an image with a geographic projection, the distances are calculated for the center latitude of the image. If the image spans more than a few degrees of latitiude, this scale bar representation will only be accurate around the center of the image and could vary greatly along the edges. For this reason, we do not recommend using the scale bar annotation on a global geographic image.
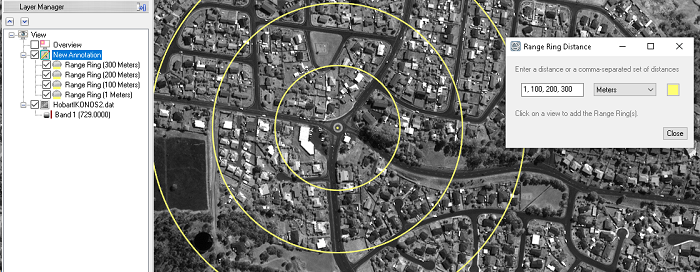
Range Ring
Range ring annotations allow you to create an annotation of a single circle, or multiple concentric circles, that are centered over a specified area. This annotation type is available when you have map information (standard, pseudo, RPC, etc.) associated with your view.
To add range rings:
- Select Range Ring from the Annotations drop-down menu in the toolbar. An Options tab is added below the ENVI Toolbox, providing fields to specify the range rings.
Specify the range rings:
To create a single range ring, enter the radius in the Ranges field. For example, enter
500to have a single range ring with a radius of 500 meters.To create concentric range rings, enter comma-separated values for the radius of each ring in the Ranges field. For example, enter
100,200,300to have range rings of 100, 200, and 300 meters.
- To change the units of measurement, click in the Units field and select the units from the drop-down list. The default is Meters.
- To change the color of the range rings shown on the view, click in the Color field and select a color from the color picker. The default is yellow.
Click in the view where you want the set the center point of the range ring(s). The rings are added to the view.
The range rings are regular annotation items that can be edited later, to change properties such as color, width, fill, transparency, and so on.
Delete Annotations
- To delete annotations in the active layer, click the Select tool.
- Select an annotation by clicking on it.
- Select multiple annotations by using Ctrl+click, or by drawing a box around the items.
- Right-click and select Delete Selected.
- To delete an annotation you are creating and to start again, press the Esc key.
- Right-click on an annotation layer in the Layer Manager and select Revert to clear all annotation item changes and to return the layer to the state it was in after it was last saved.
Affix Annotations to the Display
You can affix certain annotation items to the display so that they remain stationary while you zoom, pan, and rotate. See On the Glass Annotations Background for details.
Set the On the Glass property to True for the selected annotation item. ENVI automatically sets the Scale on Zoom and Rotate with View properties to False.
You can also right-click on the New Annotation item in the Layer Manager and enable one of these options:
- On the Glass
- Set "Scale on Zoom" to True (ignored if you enable On the Glass)
- Set "Scale on Zoom" to False (ignored if you enable On the Glass)
Scale bar annotations do not have a Scale on Zoom property.
The icons for these annotation items are updated in the Layer Manager to indicate that they are on the glass; for example:
View Metadata
You can view the metadata associated with the annotations. Right-click on the layer name in the Layer Manager and select View Metadata to open the View Metadata dialog.
Zoom Options
- To zoom to the full extent of a annotation layer, right-click on the layer name in the Layer Manager and select Zoom to Layer Extent. This centers and displays the entire layer.
- Selecting Full Extent from the Zoom drop-down menu or clicking the Zoom to Full Extent button
 in the main toolbar zooms to the combined extents of all layers for the current view.
 - If an annotation layer is georeferenced, the Zoom To drop-down list in the main toolbar displays options for Map Scale:
- To specify whether or not to scale annotation items as you zoom in or out of the display, right-click on an annotation folder in the Layer Manager and select an option:
- Set "Scale on Zoom" to True: The size of all annotation items in the selected folder will increase or decrease accordingly when the zoom level increases or decreases.
- Set "Scale on Zoom" to False: The size of all annotation items in the selected folder remains the same, regardless of the zoom level.
- You can also specify the Scale on Zoom preference item for text and symbol annotations, using the ENVI Preferences dialog.
- To jump to the center of an annotation item, right-click on the item name in the Layer Manager and select Go To Item.